Easter has always seemed a nothing sort of a holiday to me. Partly it’s because I never know when it will be (I would vote for a party that pledged to standardise Easter, but that’s another matter…) There is - of course - an R function, timeDate::Easter(), but Easter’s date will never be ingrained in the way that Christmas is, and thus anticipation will never build to the same extent. There’s not much to look forward too, either. Don’t get me wrong, I quite like chocolate; which is why I eat it whenever I feel like it, regardless of the time of year. And even when I was a pious little church-going boy, I could never actually get excited about Easter. But the end of the Easter holidays? Well, that was a different matter. Summer term meant many things - ties became optional, blazers were off most of the time, and the daily school bus ride was less of a trudge when the sun was out. The main thing, however, was the neat, flat, freshly mowed square of grass waiting for us in the middle of the playing field which meant one thing: cricket. For a few years I lived for cricket, and would play at every opportunity. And when I couldn’t play - when it was raining, or dark, or winter - I would pore over back issues of Wisden Cricket Monthly, soaking up the hallowed stats.
I guess many kids - I don’t want to fall in to gender stereotypes, but I could probably have written ‘many boys’ there without too much controversy - are introduced into quantitative thinking through a fixation with sports statistics. And cricket is great for stats - I’m not sure we have a dedicated R book yet in the way baseball does, but a game so slow and intricate, with so many things to measure and count, has spawned a wealth of stats, now fully searchable through interfaces such as cricinfo’s statsguru. Thus, more or less any notable feat in a cricket match is some kind of record - the highest score by an English wicketkeeper batting at number 7 in the 3rd innings of a test match against Pakistan at Headlingly, and so on. As a kid I lapped all this up, and most numbers up to 501 (Brian Lara’s record for the highest first class score) have some cricketing resonance for me.
As my quantitative skills became more sophisticated, however, I began to realise that what are called ‘stats’ in sport are usually just data, there to be arranged, cherry picked, or otherwise massaged to tell whichever story suits a particular commentator’s overriding narrative. Furthermore, I started to question the gold standard by which cricketers are remembered - their ‘average’. For batsmen, this is the mean number of runs they have scored per completed innings; for bowlers the mean number of runs conceded per wicket. And these are the numbers most keenly studied by students of the game, used to judge one player against another, or to assess the vagaries of form of an individual player over the course of his career.
There are a number of reasons to dislike the naive arithmetic mean, even in situations where it is a good measure of central tendency. For instance, designing public transport to be comfortable for people of average height leaves the half of the population (that into which I fit…) generally uncomfortable. But how useful is it in judging a player’s performance? Well, it depends what you want to know.
Let’s take the most famous average in cricket, 99.94 (you’ll note the precision; cricket nerds love precision). That was the average that Don Bradman ended his test career with - famously finishing in his 80th innings with a duck (0) against England at The Oval when a score of just 4 would have secured a career average of 100. Bradman’s average is the most freakish of outliers - no other batsman who has batted 20 or more times has averaged higher than 65, with 50 typically considered the halmark of an exceptional player - but a look at his figures still serves to illustrate some points.
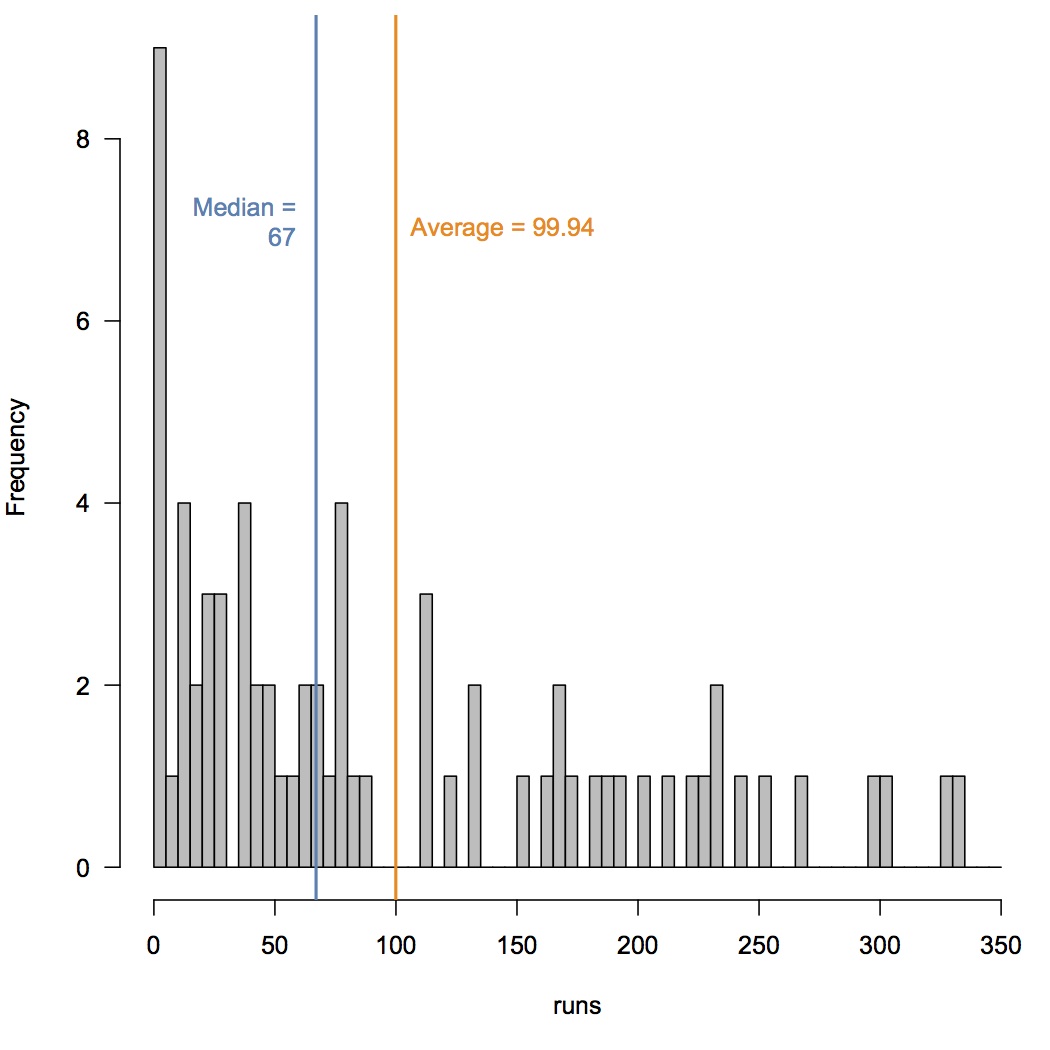
First, you can see that the distribution of Bradman’s scores is highly skewed. This makes complete intuitive sense - batsmen are always vulnerable early in their innings (lots of low scores, including seven scores of 0), but once they get ‘in’ the best batsmen capitalise with a big score. Few if any did this better than Bradman - he passed fifty 42 times, converting 29 of these to scores of 100 or more, 18 of which were what the kids these days call ‘daddy hundreds’ (>150), two thirds of these eventually ending over 200 (ten double hundreds and two triples).
But what is also clear is that Bradman hardly ever scored anything close to his average. Only three times did he finish with a score within 5 runs of 99.94 - two scores of 103, one of 102. He was not dismissed in two of these innings, so in my plot they are added to the next completed innings - which, as it happens, includes in one case the third such innings. So, there’s a noticable hole in the frequency distribution of completed innings between scores of 89 and 111, exactly where the average lies. Bradman’s average, then, is a really poor indicator of his likely score in any particular innings - he was far more likely to score 0, or 225 (±10), than 100.
What might we do as an alternative? Bradman’s median score is the far less romantic 67, something he scored close to (±10 runs) about 10% of the time. His geometric mean score (problematically removing the problematic 0s) is 45.23, which again he was close to once every ten innings. Maybe we should cite too a measure of variability - the standard deviation, say, which is 94.17, or the median absolute deviation of 80.06.
All of this though misses the point, which is that Bradman’s average tells us one thing loud and clear: he was an astonishingly good batsman. And while we might want to make some distinctions between players from different eras, or in different forms of the game, for broad comparisons the average serves pretty well. It seems silly to read too much into the decimal places - was Alan Border, with a career average of 50.56, demonstrably better than my childhood hero Viv Richards (50.23)? Of course not. Occasionally, too, you’ll get a Jason Gillespie event - a player with a career average of 18 scoring a double hundred - just as Bradman got his ducks. So on an innings by innings basis, the average might not be useful, but over the course of a year or two scores will tend to, well, average out. Does an average of 42.35 then indicate a stronger batsman, likely to score more heavily than one averaging 10.74? Even when applying the arithmetic mean to a horribly skewed distribution? Well yes, I think it does.
(Oh, and if you wondered which players have averages of 42.35 and 10.74, well, they’re on the same team, but the data aren’t from cricinfo…)